Measuring What Matters: How I Set Up Free Analytics Without Sacrificing Performance
The site was built. Lighthouse scores were 100 across the board — Performance, Accessibility, Best Practices, SEO. Everything I could measure about the site itself looked perfect.
But I had no idea if anyone was reading it.
Flying Blind
You publish a post into nothing. The site gets served, but you have no idea if anyone’s reading or if they bounce in two seconds. I wanted to fix that without undoing everything I’d spent weeks perfecting.
The constraints were clear:
- Every tool must be free. This is a personal site, not a SaaS product. I am not paying $30/month for heatmaps.
- Lighthouse scores must stay at 100. I did not spend weeks optimizing performance and accessibility to throw it away on a bloated tracking script.
- No cookie consent banners. I want visitors to read my content, not dismiss popups. Privacy should be the default, not a toggle.
The Google Analytics Question
Let me address this directly, because it is the first thing everyone asks: “Why not just use Google Analytics?”
Google Analytics 4 is free — in the monetary sense. But the real cost is measured in kilobytes, cookies, and complexity.
The script is ~70KB. For context, the entire Atkinson Hyperlegible font that this site uses weighs about 15KB. GA4’s tracking script is nearly five times heavier than a custom font. On a site targeting Lighthouse 100, that is not a rounding error — it is a direct threat to your Performance score. The script adds 50-150ms of Total Blocking Time on the main thread.
It sets cookies. GA4 places _ga and _ga_* first-party cookies on every visitor’s browser. Under GDPR, these constitute personal data. Which means you need a cookie consent banner. Which means more JavaScript, a UI element that causes layout shifts, and a degraded experience for every first-time visitor.
The workarounds add complexity. You can use Partytown to offload GA4 to a web worker and keep the main thread clean. But Partytown has compatibility issues with Astro’s View Transitions, adds build complexity, and does not solve the cookie problem.
Here is the honest assessment: everything GA4 provides — pageviews, sessions, referrers, demographics, real-time data — can be covered by lighter, cookieless alternatives. The only things GA4 uniquely offers are advanced audience segmentation and conversion funnels, which a personal blog does not need.
So I made the decision: no GA4. Not because it is bad — it is an incredibly powerful platform — but because the trade-offs do not make sense for this specific site.
The Stack I Chose
Instead of one monolithic analytics tool, I assembled a stack of specialized free tools. Each one is the best free option for what I need to measure.
Cloudflare Web Analytics — The Freebie
This one was almost too easy. Since the site is deployed on Cloudflare Pages, I already had access to Cloudflare Web Analytics. It is included for free with every Cloudflare account.
What makes it special is that it requires zero code changes. Cloudflare injects a tiny beacon (~1KB) at the edge — it never touches your source code, your build pipeline, or your HTML. You enable it in the dashboard with a single click.
It provides:
- Page views, visits, and unique visitors
- Top pages by traffic
- Referral sources
- Visitor countries, browsers, and device types
- Real User Monitoring (RUM) with Core Web Vitals: LCP, INP, CLS, FCP, TTFB
That last point is crucial. Lighthouse gives you lab scores — measurements taken under controlled conditions. Cloudflare gives you field data — what real users actually experience. You might score 100 on Lighthouse but have a slow LCP for users in South America on mobile. Only RUM data reveals that.
No cookies. No consent banner. No performance impact. It was activated before I wrote a single line of analytics code.
Umami — The GA4 Replacement
Umami is an open-source, privacy-first analytics tool. The cloud version has a free tier that supports up to 1 million events per month — more than enough for any personal site.
What drew me to Umami was the combination of features and philosophy:
- Cookieless by design. No cookies, no fingerprinting, no personal data collection. GDPR compliant out of the box.
- ~2KB script. Compare that to GA4’s ~70KB. The script loads with
deferand has zero impact on page rendering. - Clean dashboard. Top pages, referrers, UTM campaign tracking, custom events, bounce rate, time on page — presented in a fast, clutter-free interface.
- Custom events. I can track specific interactions — external link clicks, language switches, blog post engagement — by calling a simple
trackEvent()function.
The integration was straightforward. One <script> tag in BaseHead.astro, conditionally rendered only when the PUBLIC_UMAMI_WEBSITE_ID environment variable is set:
{ANALYTICS.umami.websiteId && (
  <script
    defer
    src={ANALYTICS.umami.scriptUrl}
    data-website-id={ANALYTICS.umami.websiteId}
  />
)}
If the environment variable is not configured — like in local development — the script simply does not render. Zero overhead.
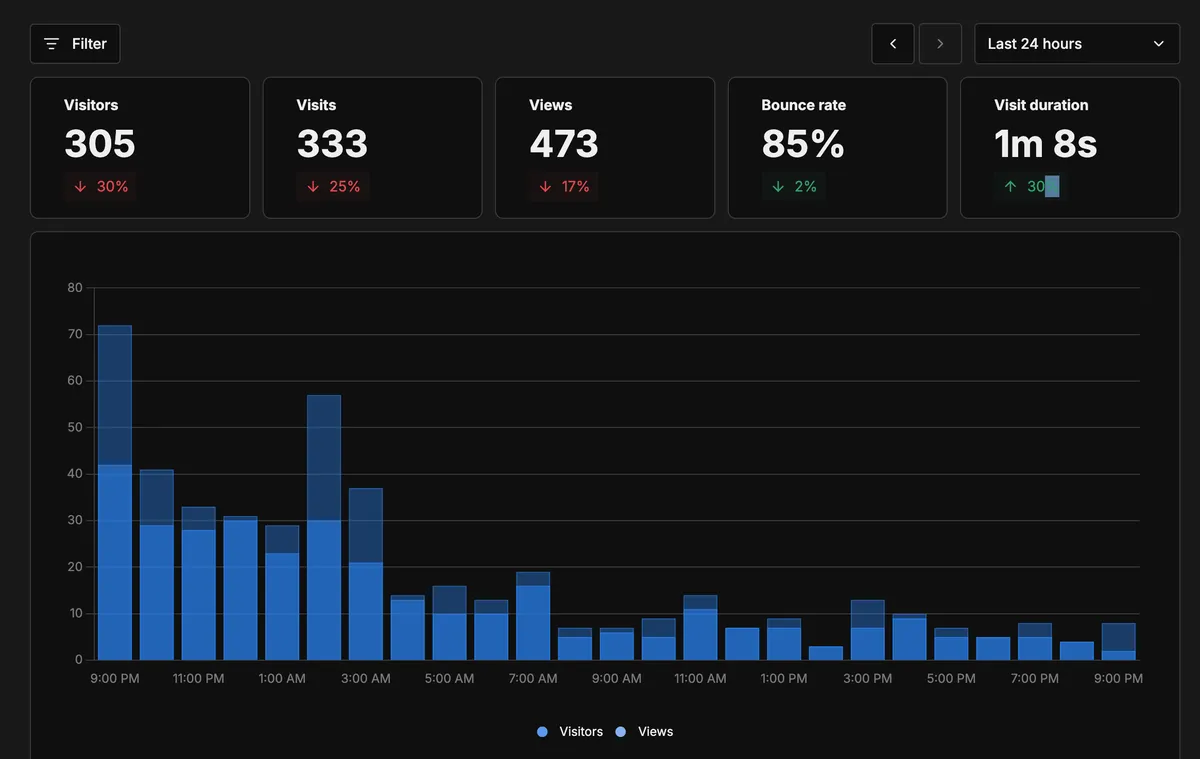
This is what the Umami dashboard looks like one day after going live — visitors, views, bounce rate, visit duration, all in one place:
Umami Custom Events — Click Tracking Without Extra Weight
Umami is not only page views. It also supports custom events, which lets me track meaningful clicks without adding a second behavior-recording script.
For a blog, this gives actionable data with minimal payload:
- Do readers click related posts? Track clicks on the “related articles” block.
- Do readers click key CTAs? Track newsletter, contact, and outbound profile links.
- Do readers use language switchers or tags? Track filter and navigation interactions.
The instrumentation is explicit and privacy-friendly: only the events I decide to track are sent.
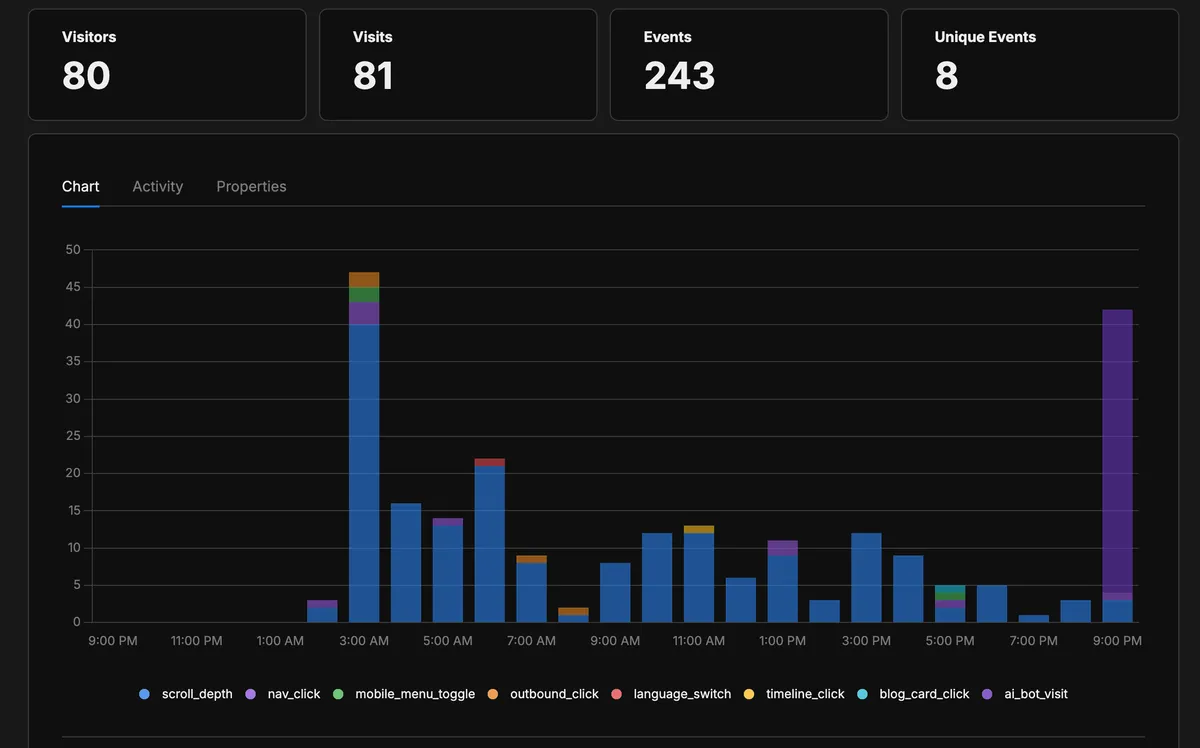
Here’s what the events section looks like — each event type color-coded in the chart, with counts below:
Google Search Console + Bing Webmaster Tools — The SEO Layer
These two are not analytics scripts — they are dashboard-only tools. For Google Search Console, domain ownership can be verified via DNS TXT. Zero performance impact.
Google Search Console answers the question every content creator cares about: “What are people searching for to find my site?” It shows which queries generate impressions, which ones get clicks, and the average position for each. For a blog, this is gold. You can see which posts rank for which terms, which are trending up, and which have high impressions but low click-through (meaning the title and description need work).
Bing Webmaster Tools provides similar search data, but with a unique addition: the AI Performance report. Launched in 2026, it shows how often your content is cited in Microsoft Copilot and AI-generated summaries in Bing. As AI-driven search becomes more prevalent, this is one of the only tools that gives visibility into how generative engines use your content.
Bing verification tag is conditionally rendered:
{ANALYTICS.verification.bing && (
  <meta name="msvalidate.01" content={ANALYTICS.verification.bing} />
)}
Lighthouse CI — The Automated Guardian
The final piece is not about measuring visitors — it is about protecting everything I built. Lighthouse CI is a GitHub Actions workflow that runs Lighthouse audits automatically on every pull request.
It builds the site, tests key pages against performance budgets, and fails the PR if any score drops below the threshold. The budgets are set to match the site’s current standards:
- Performance: >= 95
- Accessibility: = 100
- Best Practices: >= 95
- SEO: >= 95
The thresholds are slightly below 100 to account for CI environment variance (Lighthouse scores can fluctuate by 2-3 points between runs), while still catching any real regression. If I accidentally add a render-blocking script, an image without dimensions, or break an ARIA pattern, Lighthouse CI will flag it before the code reaches production.
The Performance Test
The question I kept asking myself throughout this process: did adding all these analytics break my Lighthouse 100 scores?
The total overhead of all analytics scripts is approximately 2KB loaded asynchronously:
- Umami: ~2KB (defer)
- Verification meta tags: negligible
For comparison, a single blog post hero image weighs 50-200KB. The analytics scripts are lighter than a small JPEG.
More importantly, all scripts use defer or async loading, which means they do not block the page render. They do not affect Largest Contentful Paint (LCP), Cumulative Layout Shift (CLS), or Total Blocking Time (TBT) — the three metrics that drive Lighthouse’s Performance score.
The answer: no, the scores held at 100. The site deploys with the same perfect scores it had before analytics were added. The key was choosing the right tools from the start — lightweight, async scripts instead of a single heavy tracker.
What I Can Measure Now
With this stack in place, I have answers to questions I could not answer before:
| Question | Tool |
|---|---|
| How many people visit the site? | Cloudflare + Umami |
| Which blog posts get the most traffic? | Umami (Top Pages) |
| Where do visitors come from? | Umami (Referrers) |
| What do people search to find the site? | Google Search Console |
| Do readers engage with key post elements? | Umami custom events |
| Where do visitors click? | Umami custom click events |
| Is the site fast for real users? | Cloudflare (Core Web Vitals) |
| Will a code change break performance? | Lighthouse CI (automatic on PRs) |
| Is content cited in AI tools? | Bing Webmaster (AI Performance) |
Traffic, behavior, search, performance, and AI visibility — all free, no privacy trade-offs.
The Architecture Decision: Conditional Everything
Every analytics integration is conditional. The scripts and meta tags only render when their corresponding environment variables are set.
In practice, this means:
- Local development has zero analytics overhead. No tracking scripts, no external requests.
- Production loads only the tools you have configured. Set one variable, get one tool. Set all of them, get the full stack.
- New environments work immediately without any analytics — nothing breaks if the variables are not configured.
This was implemented through a centralized ANALYTICS configuration object in src/lib/constances.ts that reads from import.meta.env:
export const ANALYTICS = {
  umami: {
    websiteId: import.meta.env.PUBLIC_UMAMI_WEBSITE_ID || '',
    scriptUrl: 'https://cloud.umami.is/script.js',
  },
  verification: {
    bing: import.meta.env.PUBLIC_BING_SITE_VERIFICATION || '',
  },
} as const;
All variables use Astro’s PUBLIC_ prefix convention, which makes them available at build time for client-side rendering. The as const assertion gives TypeScript full type inference over the configuration.
The First Day of Data
One day after configuring everything, the dashboard was already telling a story. Here’s what showed up.
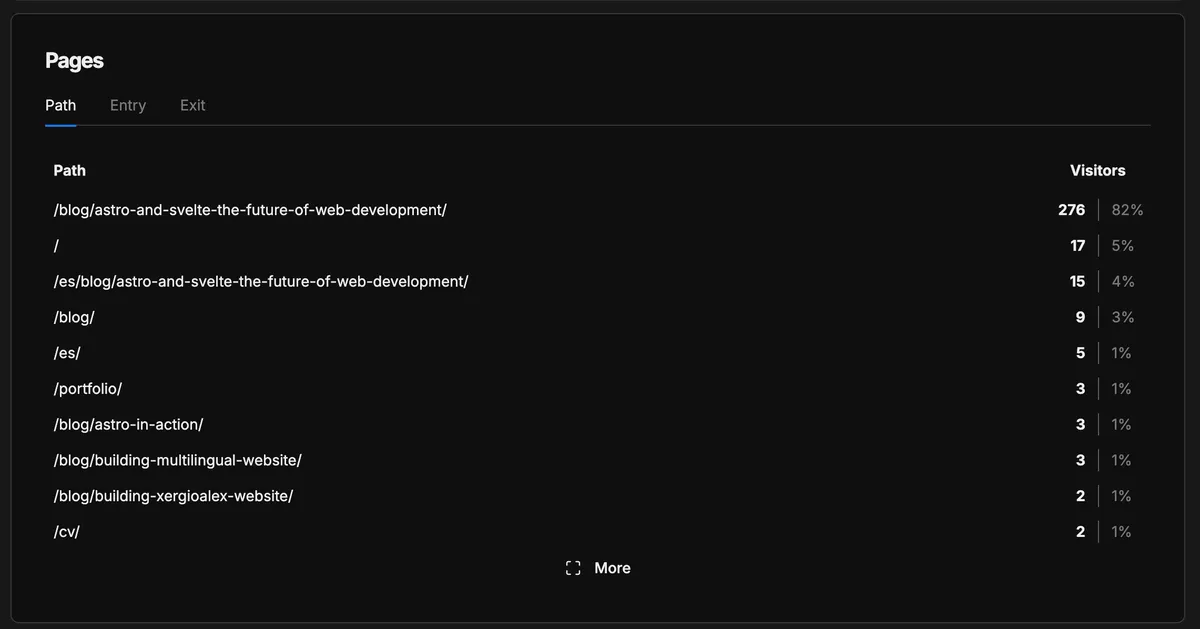
Which pages get the most visits — the first post in the series dominated with 82% of traffic:
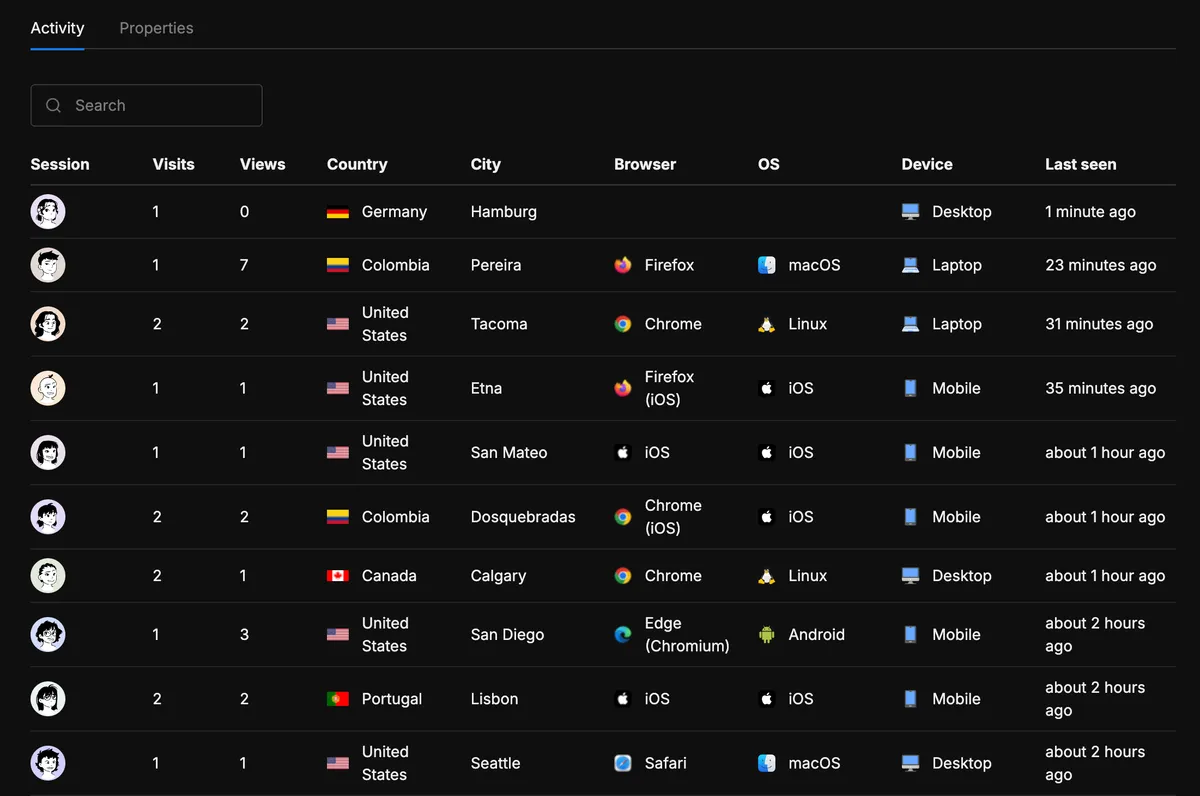
Individual visitor sessions — country, city, browser, device, all without cookies:
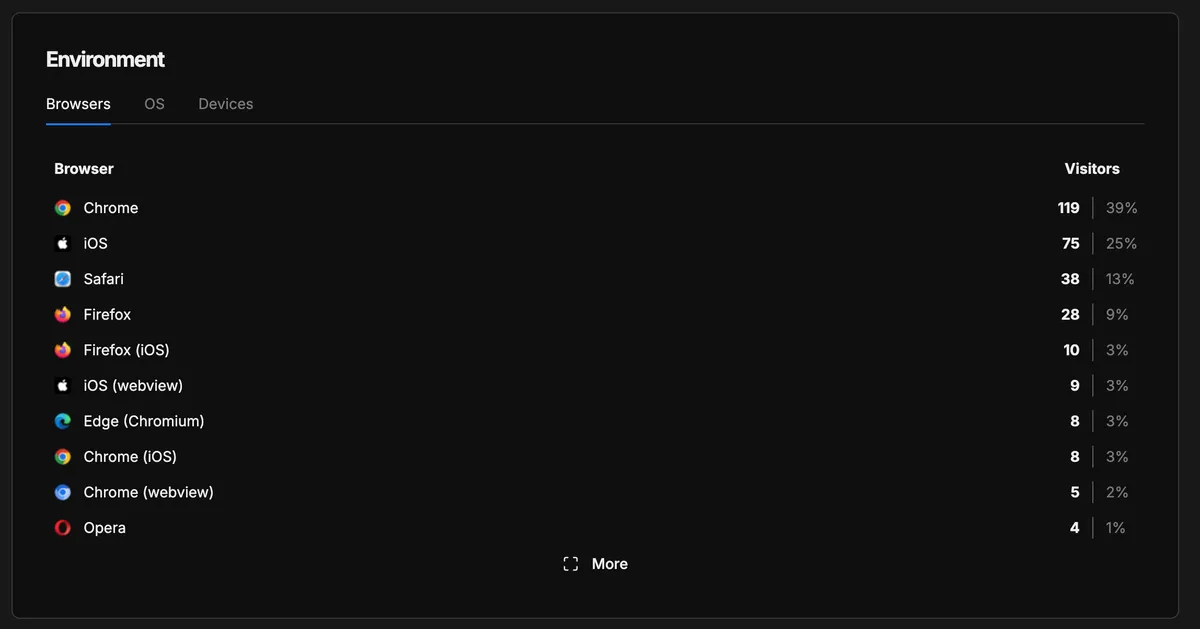
The browser breakdown — Chrome leads at 39%, followed by iOS and Safari:
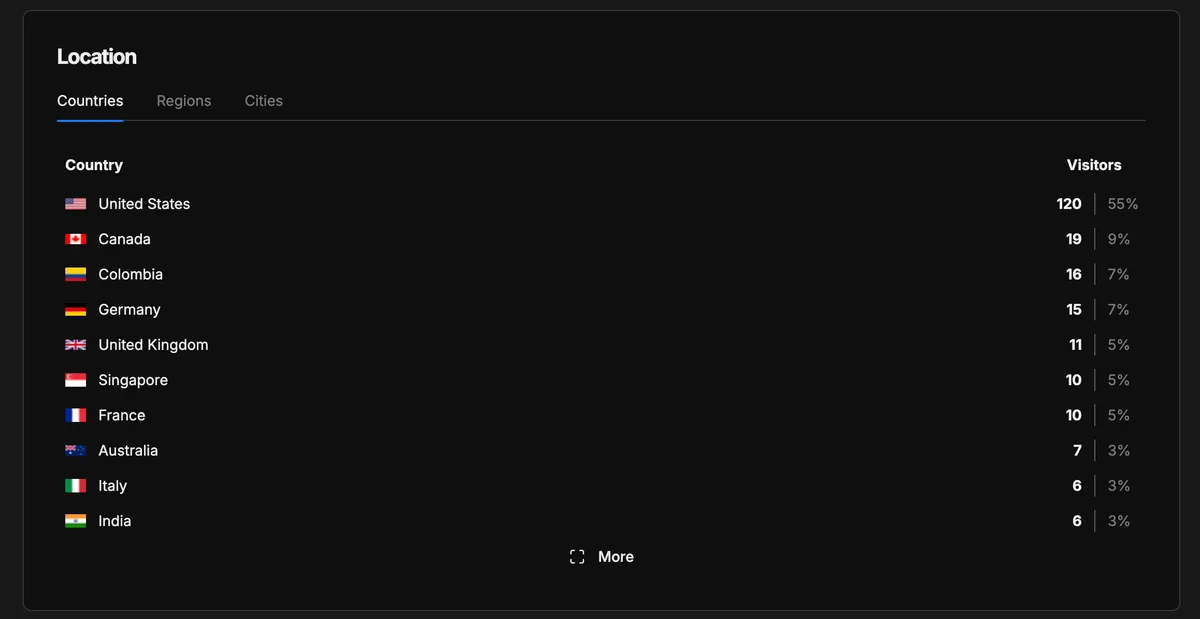
Where visitors come from — 11 countries in the first 24 hours, with the US at 55% and Colombia at 7%:
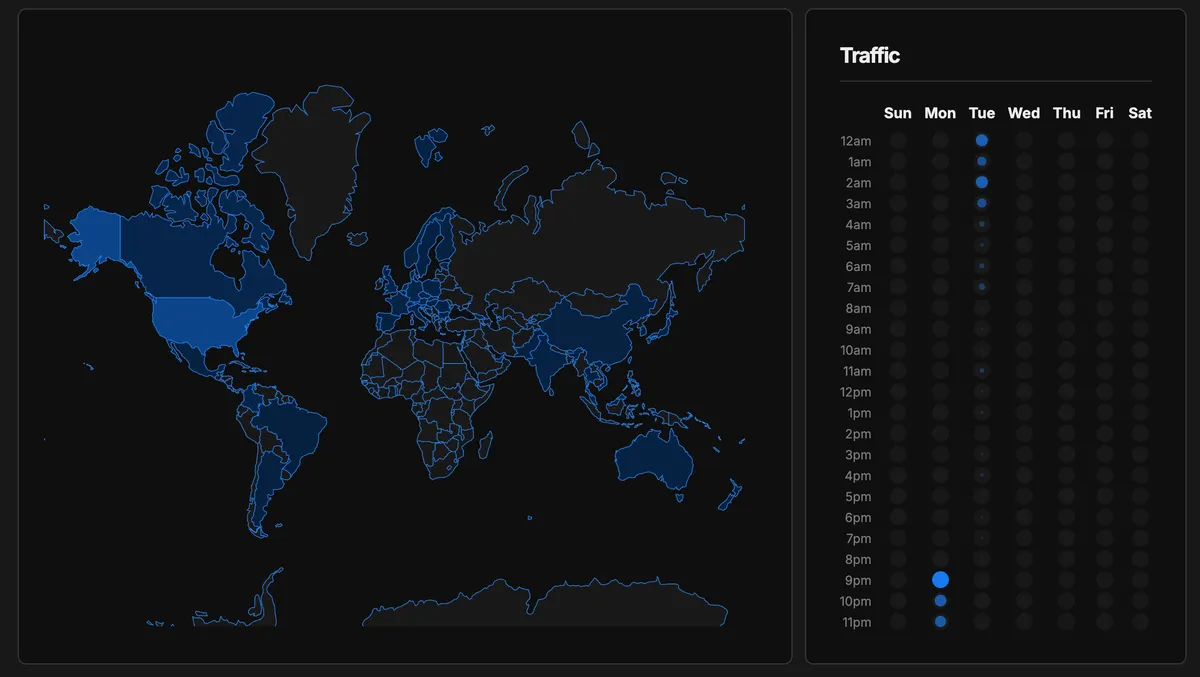
And the geographic view with the traffic heatmap — when visitors arrive during the week:
All of this from a 2KB script, no cookies, and zero impact on Lighthouse scores.
Looking Back
This was the fourth chapter of building XergioAleX.com:
- Building the platform — architecture, technology choices, the journey from one page to a full site.
- The brand — the Ninja Coder visual identity that gave the site its soul.
- Perfecting the scores — the meticulous work of achieving Lighthouse 100 across all categories.
- Measuring the impact — adding a complete analytics stack without undoing any of that work.
Each chapter built on the previous one. The architecture decisions from chapter one (Astro, static generation, islands) and the brand identity from chapter two gave the site its foundation. The performance work from chapter three set the constraint for chapter four: whatever analytics I added could not compromise what I had already achieved.
Fast, accessible, measured, and private. All free. You don’t have to choose between understanding your users and respecting them.
Resources
- Cloudflare Web Analytics — Edge-injected RUM with Core Web Vitals
- Umami Analytics — Open-source, cookieless traffic analytics
- Google Search Console — Search performance and indexation
- Bing Webmaster Tools — Search + AI citation tracking
- Lighthouse CI — Automated performance audits in CI

Sergio Alexander Florez Galeano
CTO & Co-founder at DailyBot
Colombian software engineer and entrepreneur (DailyBot, YC S21). I write about AI agents, developer tools, startups, and the craft of software engineering — and I build this site in the open at XergioAleX.com.
Stay in the loop
Get notified when I publish something new. No spam, unsubscribe anytime.
No spam. Unsubscribe anytime.